Budget Pie Chart
Enter your monthly costs and see at a glance how much of your budget goes where. Download the chart as an image or slide. Free, no sign-up.
The chart updates as you type. Saved in this browser only.
How it works
- 1Step 1
Enter your costs
The example starts with rent, food, transport, savings and fun. Replace the amounts and add rows for your own categories.
- 2Step 2
Read the shares
Each slice shows its percentage of the total, so you can see which cost takes the biggest bite.
- 3Step 3
Download or share
Save a PNG for a family budget meeting or a class, CSV to keep the numbers, or PPTX for a presentation.
A budget pie chart shows shares, not totals
A budget pie chart answers one question: of everything you spend in a month, what share goes to each category? Rent at 1,200 out of 2,280 is 53% – more than half the budget – which is far easier to feel as a slice than as a row in a spreadsheet. Type your categories and monthly amounts. The chart adds them up and shows each one as a percentage. Keep it to the big categories – housing, food, transport, savings, debt, fun – and group small items into Other so the chart stays readable. The chart is drawn in your browser and your numbers are saved only on this device; nothing is sent to us.
We tested it (1 Nov 2026)
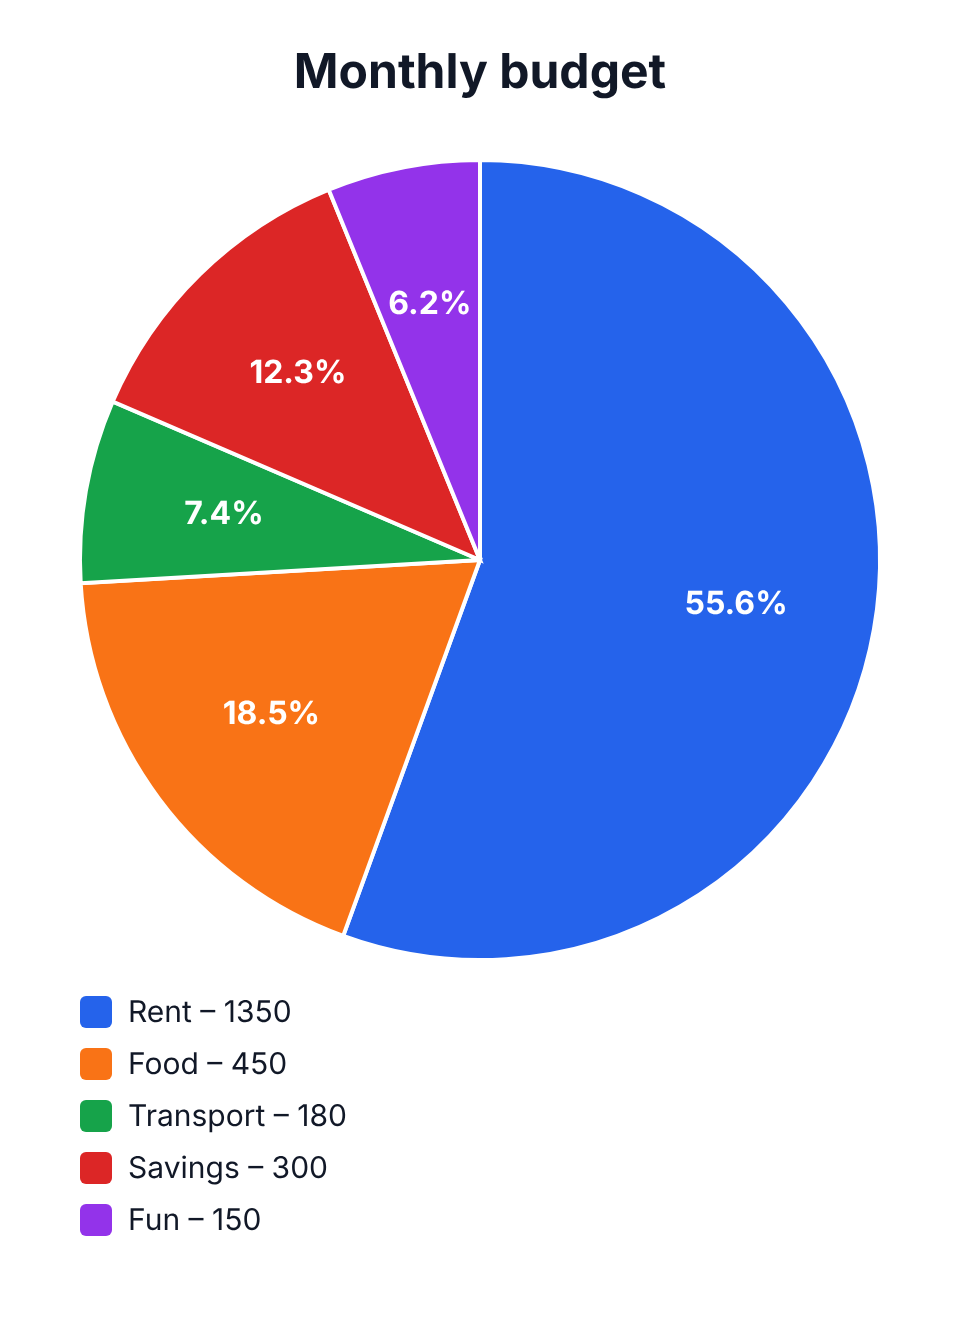
On 1 November 2026 we opened this page with the monthly budget example (rent 1,200, food 450, transport 180, savings 300, fun 150), raised rent to 1,350 and pressed Download PNG. The file (monthly-budget.png, 960 × 1320 px) shows rent at 55.6%, food 18.5%, savings 12.3%, transport 7.4% and fun 6.2% of the 2,430 total.
Our read: one changed number moved every share, which is exactly the what-if you want when planning a budget. The chart shows shares only – the total amount appears nowhere on the image, so write it in the title (for example 'Monthly budget – 2,430').
On a phone
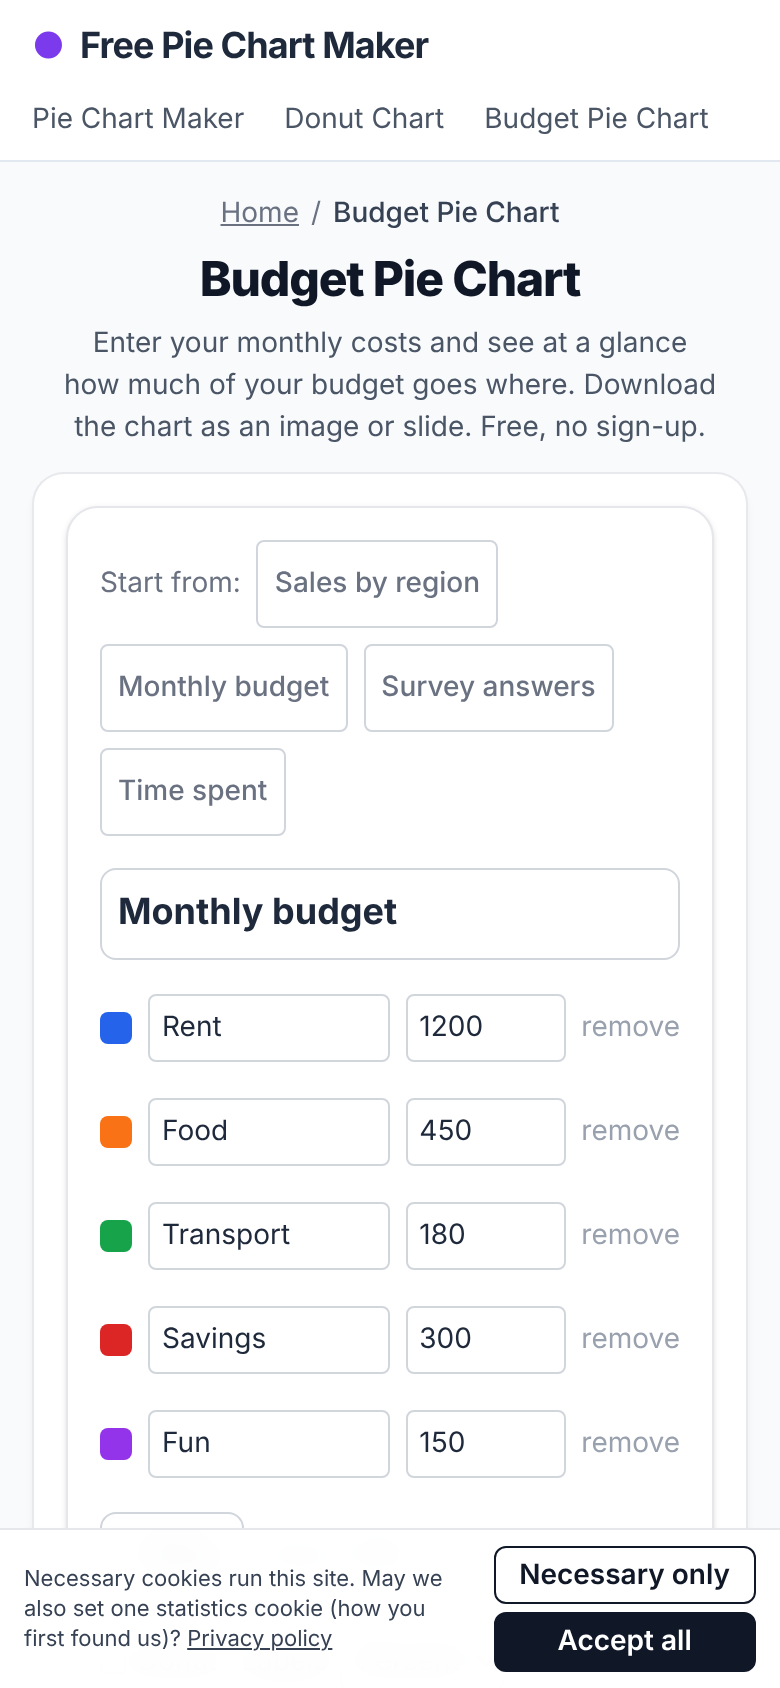
The same day on a 390 px wide phone screen the page fit without sideways scrolling; the data rows come first and the live chart and download buttons follow below.
Using the chart to check a budget rule
Many budgeting guides suggest rough splits, such as about half for needs, a smaller share for wants and a fixed share for saving. Enter your real numbers, then look at the needs slices together: if they are well over half of the pie, that is where to look first. Treat any rule of thumb as a starting point – your rent and your city matter more than a formula.
Ideas for budget charts
A monthly household budget, a student budget for a term, an event or wedding budget, a project budget for a class or a small team, or a before-and-after pair of charts to show the effect of a change. For a before-and-after, make the first chart, download it, then edit the numbers and download again.
Frequently asked questions
Is the budget pie chart maker free?
Yes. It is free, needs no account and adds no watermark.
Are my numbers private?
Yes. The chart runs in your browser and saves your data only on this device; nothing is uploaded.
Can I show amounts instead of percentages?
Yes. Switch the labels to values to show the amounts, or to none for a clean chart.
Can I make a yearly budget chart?
Yes. Enter yearly amounts instead of monthly ones; the percentages stay the same.
Related AI Generators & Tools
Browse focused, 100% free web utilities – no sign-up or credits required.