Donut Chart Maker
Type your numbers and get a clean donut (ring) chart straight away. Download it as PNG, SVG, CSV or a PowerPoint slide. Free, no sign-up.
The chart updates as you type. Saved in this browser only.
How it works
- 1Step 1
Enter your data
Add a label and a value for each slice, or start from the sales, budget, survey or time example.
- 2Step 2
Style the ring
Show percentages, values or no labels, and pick a colour set. Untick Donut to switch to a full pie.
- 3Step 3
Download
PNG for slides and documents, SVG for print, CSV for your data, or PPTX for PowerPoint.
What a donut chart is good for
A donut chart is a pie chart with the centre cut out. It shows the same thing – how a whole splits into parts – but the ring shape makes it easier to compare slices by their arc length, and the empty middle is a natural place for a total or a headline when you put the chart into a slide. Enter a label and a number for each slice. The values do not have to add up to 100: the chart works out each share and shows it as a percentage. Keep it to about two to seven slices; with more, small slices become thin slivers that nobody can read. Everything runs in your browser and your data is saved only on this device.
We tested it (1 Nov 2026)
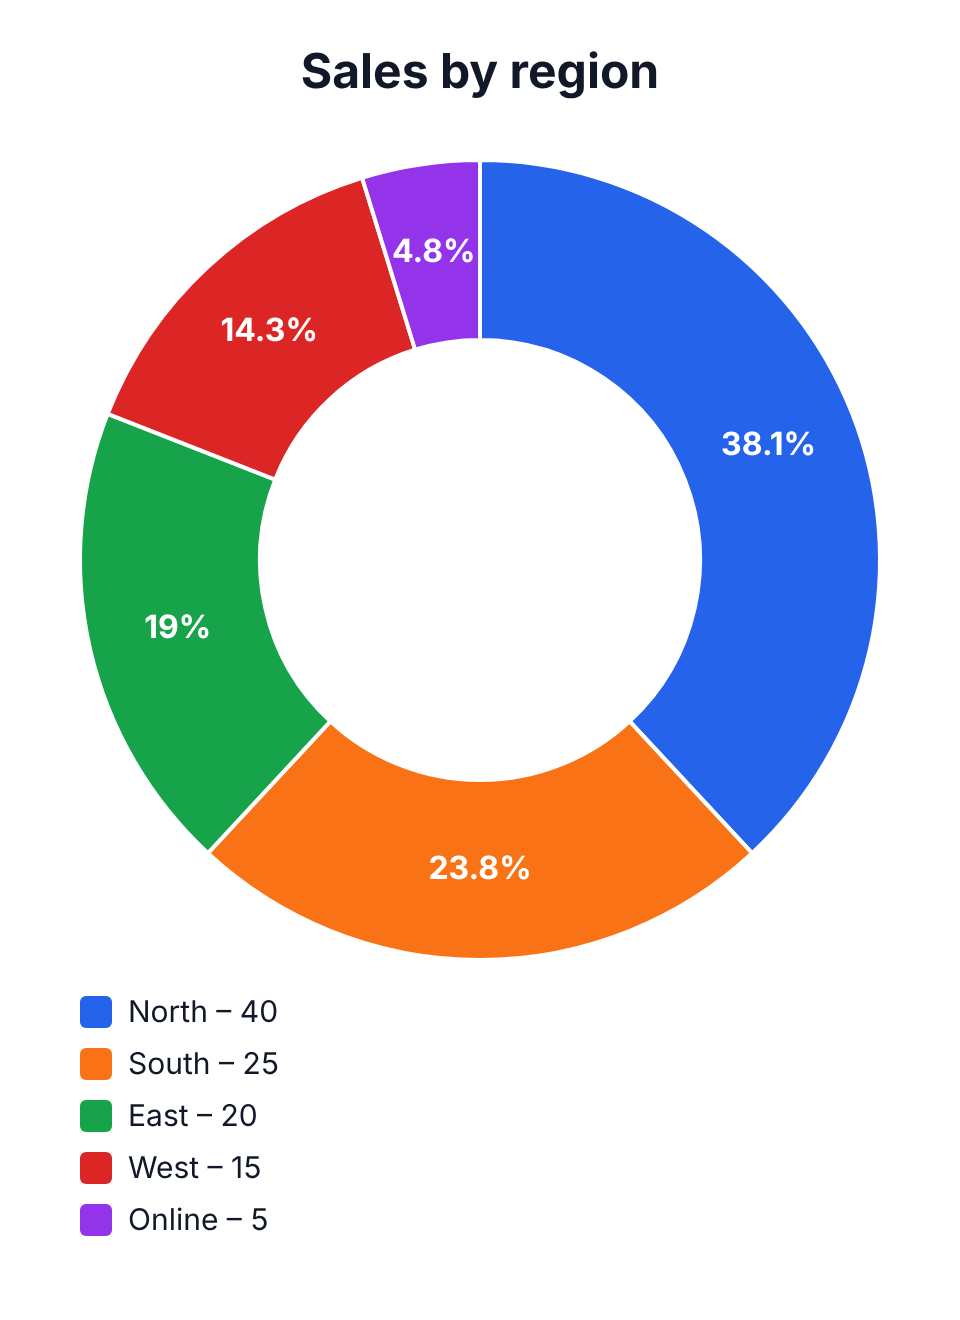
On 1 November 2026 we opened this page in a desktop browser with the sales-by-region example, changed North from 35 to 40 and pressed Download PNG. The file (sales-by-region.png, 960 × 1320 px) shows the ring with North 38.1%, South 23.8%, East 19%, West 14.3% and Online 4.8%, and a legend with the raw values underneath.
Our read: the shares recalculated the moment we typed, and even the 4.8% slice kept its label. The centre of the ring stays empty – there is no option to print a total in the middle, so add it in your slide if you need it.
On a phone
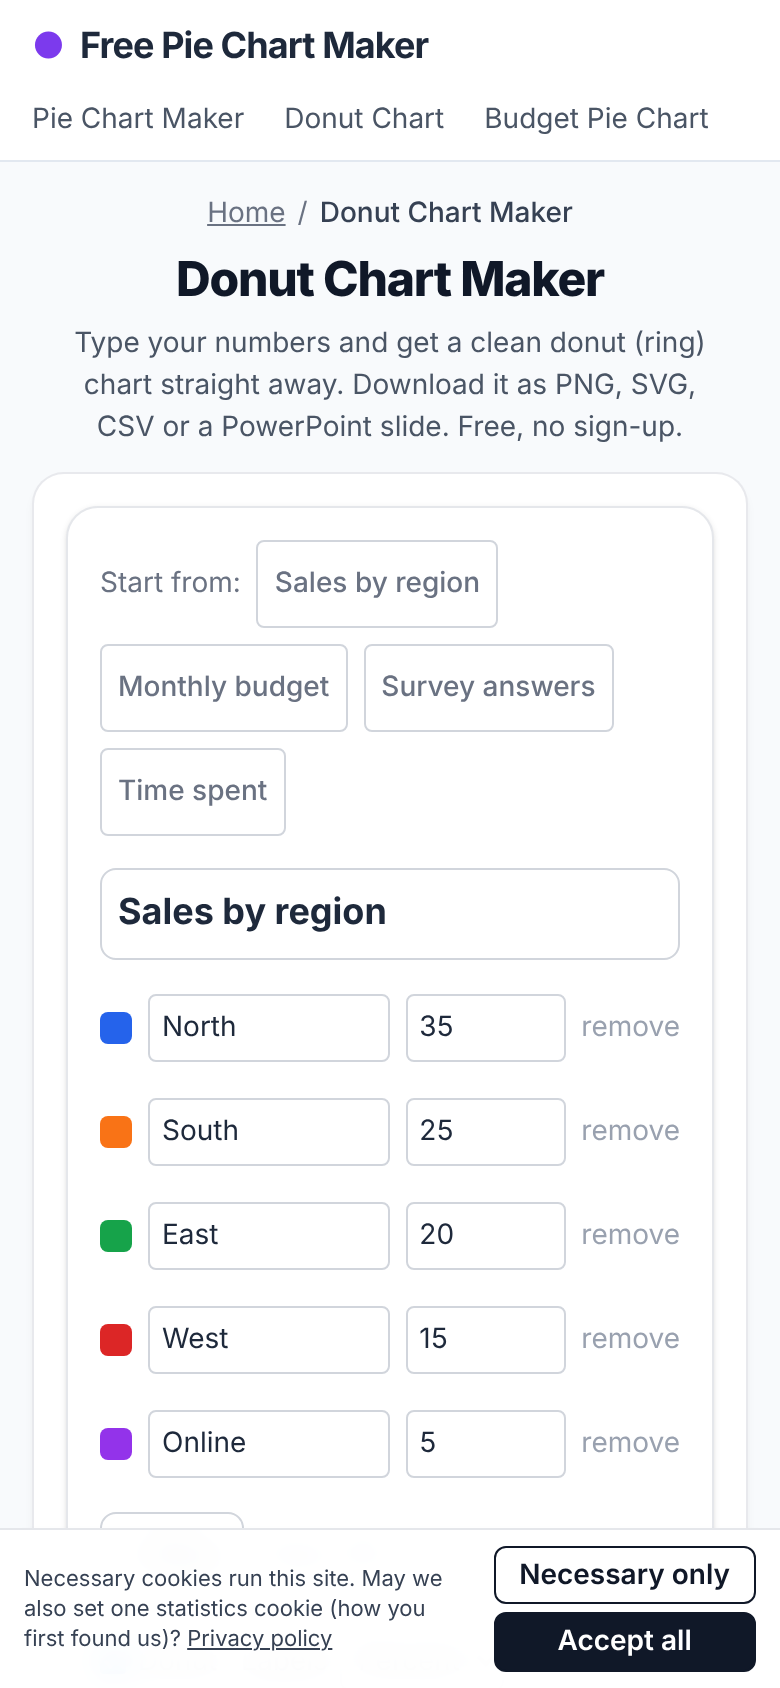
The same day on a 390 px wide phone screen the page fit without sideways scrolling; the data rows come first and the live chart and download buttons follow below.
Donut chart or pie chart?
Use a donut when the chart sits in a dashboard or slide next to other charts – it looks lighter and leaves room for a number in the middle. Use a full pie when you have only two or three slices and want the split to be obvious at a glance. The data is identical, so you can switch with one tick box and compare.
Tips for a readable donut chart
Sort slices from largest to smallest. Put an Other slice last for everything under about 5%. Show percentages rather than raw values when the audience cares about shares. Use clearly different colours for neighbouring slices and avoid red-green pairs, which many people cannot tell apart.
Frequently asked questions
Is the donut chart maker free?
Yes. It is free, has no watermark and needs no account.
Can I put the donut chart into PowerPoint?
Yes. Download PPTX for a ready slide, or download the PNG and insert it as a picture.
Do my values have to add up to 100?
No. Enter any positive numbers; each slice is shown as its share of the total.
Is my data uploaded?
No. The chart is drawn in your browser and your data is saved only on this device.
Related AI Generators & Tools
Browse focused, 100% free web utilities – no sign-up or credits required.