Pie Chart for Survey Results
Enter how many people picked each answer and get a pie chart with percentages straight away. Download for a report or slide. Free, no sign-up.
The chart updates as you type. Saved in this browser only.
How it works
- 1Step 1
Enter answer counts
One row per answer option, with the number of responses. The example uses a five-point satisfaction scale.
- 2Step 2
Check the percentages
The chart converts counts into shares of all responses, so you do not need to calculate anything.
- 3Step 3
Download for your report
PNG for a report or slide, SVG for print, CSV with the calculated percentages, or a PPTX slide.
When a pie chart suits survey data
A pie chart works for a single-choice survey question where every respondent picked exactly one answer, so the slices add up to all responses: a satisfaction scale, a yes/no/unsure question, or which plan someone uses. Enter each answer option and how many people chose it. The chart works out the percentages for you – 42 out of 100 is shown as 42%. Keep the answer order of your question (for example from Very satisfied to Very dissatisfied) so readers can follow the scale around the circle. It runs in your browser; your survey numbers stay on this device.
We tested it (1 Nov 2026)
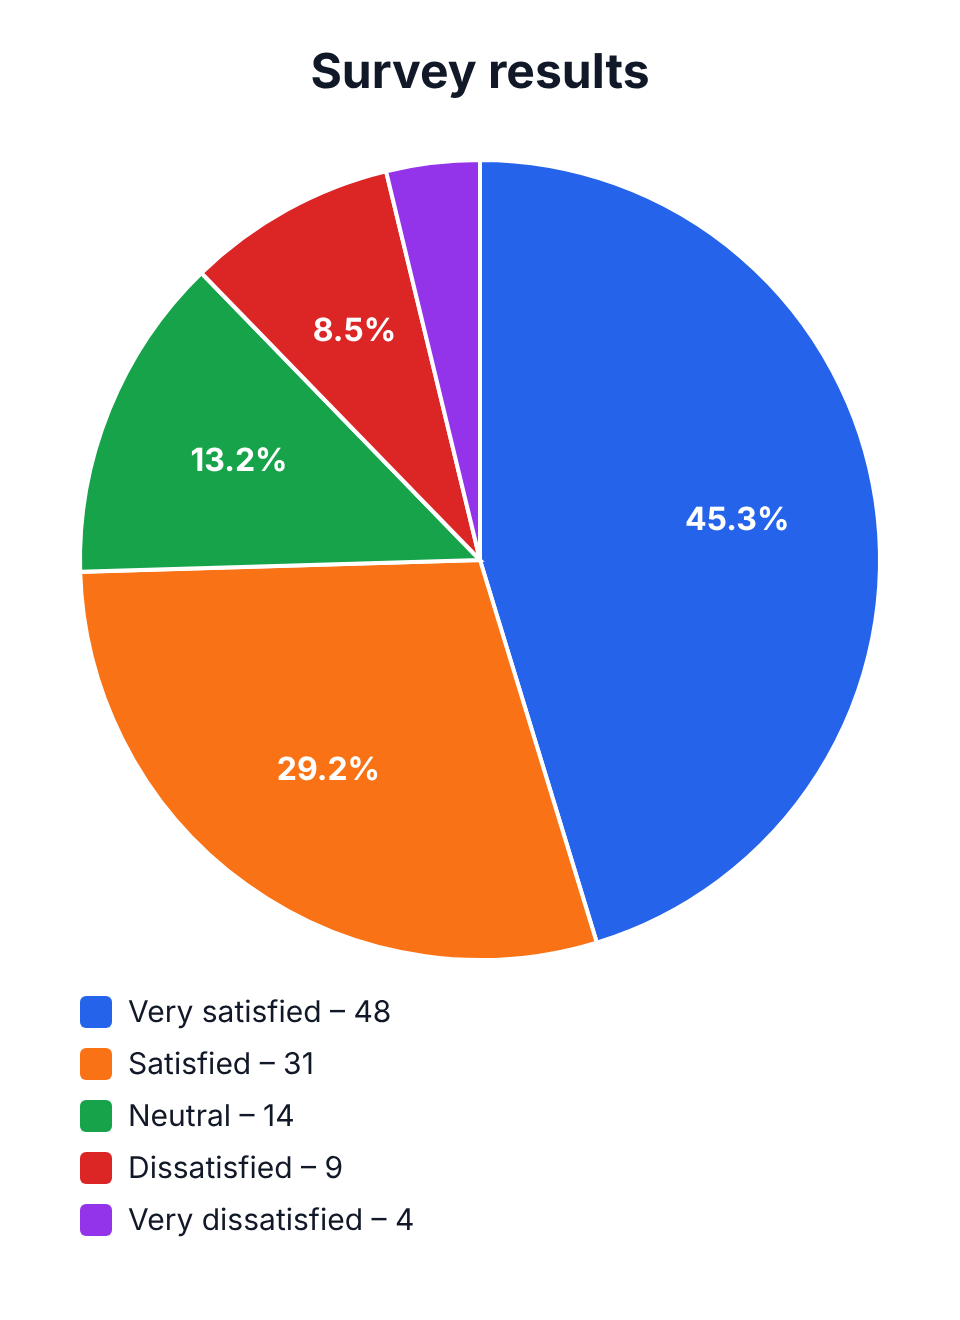
On 1 November 2026 we opened this page with the satisfaction example, changed Very satisfied from 42 to 48 responses and pressed Download PNG. The file (survey-results.png, 960 × 1320 px) shows Very satisfied 45.3%, Satisfied 29.2%, Neutral 13.2% and Dissatisfied 8.5%, with the counts in the legend.
Our read: entering counts and getting percentages works without any maths. One weakness: the smallest slice, Very dissatisfied (4 of 106, about 3.8%), was drawn without a percentage label because it is too thin – only its legend entry shows the count. If small answers matter in your report, switch labels to values or mention them in the caption.
On a phone
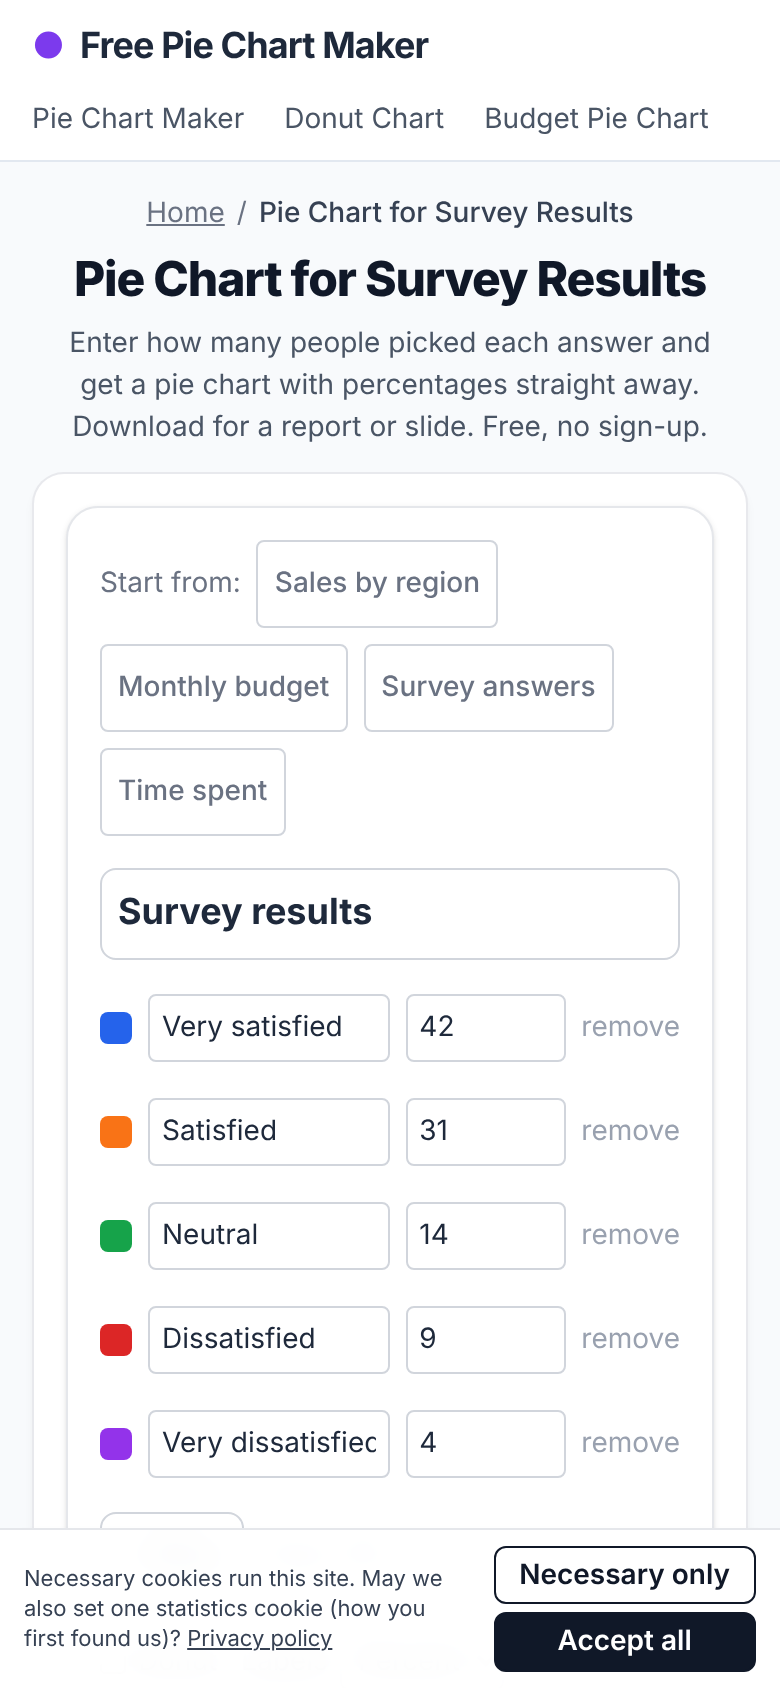
The same day on a 390 px wide phone screen the page fit without sideways scrolling; the data rows come first and the live chart and download buttons follow below.
When not to use a pie chart for a survey
Do not use a pie for multiple-choice questions where people could tick several answers – the counts add up to more than the number of respondents, so the shares are wrong. Use a bar chart instead. A bar chart is also better when you want to compare the same question across groups or over time.
Report the sample size
A pie chart shows shares, which hides how many people answered. Write the number of responses in the chart title or caption, such as 'Customer satisfaction (n = 100)'. With small samples, one or two answers move a slice a lot, so say so in the text.
Frequently asked questions
Can I enter counts instead of percentages?
Yes. Enter the number of responses for each answer; the chart calculates the percentages.
How many answer options can a pie chart show?
About two to seven read well. Group rare answers into Other if you have more.
Can I export the percentages?
Yes. Download CSV to get each answer, its count and the calculated percentage.
Is it free?
Yes. Free, no account, no watermark, and your data is not uploaded.
Related AI Generators & Tools
Browse focused, 100% free web utilities – no sign-up or credits required.